matplotlib不同类型的图
import matplotlib.pyplot as plt
import numpy as np
import pandas as pd
import math
线性图
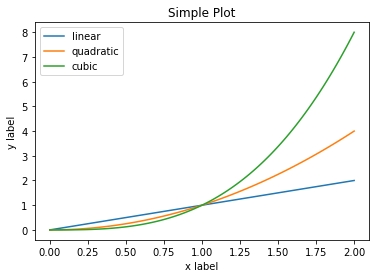
使用plot或者subplots可以创建线形图
x = np.linspace(0, 2, 100)
# Note that even in the OO-style, we use `.pyplot.figure` to create the figure.
fig, ax = plt.subplots() # Create a figure and an axes.
ax.plot(x, x, label='linear') # Plot some data on the axes.
ax.plot(x, x**2, label='quadratic') # Plot more data on the axes...
ax.plot(x, x**3, label='cubic') # ... and some more.
ax.set_xlabel('x label') # Add an x-label to the axes.
ax.set_ylabel('y label') # Add a y-label to the axes.
ax.set_title("Simple Plot") # Add a title to the axes.
ax.legend() # Add a legend.
# 显示中文设置...
plt.rcParams['font.sans-serif'] = ['SimHei'] # 步骤一(替换sans-serif字体)
plt.rcParams['axes.unicode_minus'] = False # 步骤二(解决坐标轴负数的负号显示问题)
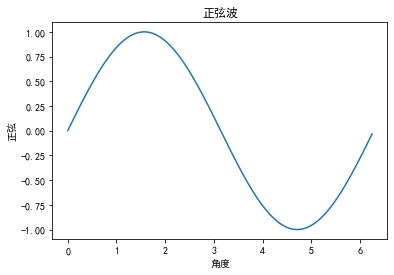
x = np.arange(0, math.pi*2, 0.05)
y = np.sin(x)
plt.plot(x,y)
plt.xlabel(u"角度")
plt.ylabel("正弦")
plt.title('正弦波')
plt.show()

条形图
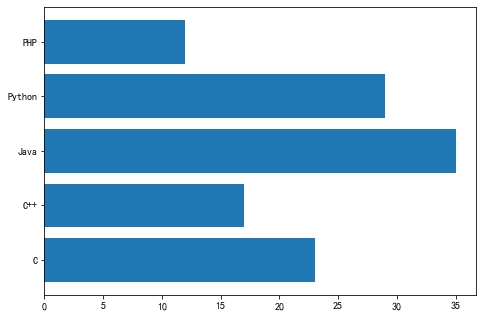
条形图使用bar()方法来创建
横向条形图使用barh()方法来创建
matplotlib.pyplot.bar(x, height, width=0.8, bottom=None, *, align='center', data=None, **kwargs)
https://matplotlib.org/api/_as_gen/matplotlib.pyplot.bar.html#matplotlib.pyplot.bar
条形图的参数:
x
- 表示条形的x
坐标的标量序列。如果x
是条形中心(默认)或左边缘,则对齐控件。height
- 标量或标量序列表示条的高度。width
- 标量或类似数组,可选。条形的宽度默认为0.8
。bottom
- 标量或类似数组,可选。条形的y
坐标默认为None
。align
-{'center','edge'}
,可选,默认:center
。
plt.rcParams['font.sans-serif'] = ['SimHei']
plt.rcParams['axes.unicode_minus'] = False
fig = plt.figure()
ax = fig.add_axes([0,0,1,1])
langs = ['C', 'C++', 'Java', 'Python', 'PHP']
students = [23,17,35,29,12]
ax.bar(langs,students)
plt.show()

plt.rcParams['font.sans-serif'] = ['SimHei']
plt.rcParams['axes.unicode_minus'] = False
fig = plt.figure()
ax = fig.add_axes([0,0,1,1])
langs = ['C', 'C++', 'Java', 'Python', 'PHP']
students = [23,17,35,29,12]
ax.barh(langs,students)
plt.show()

直方图
直方图是数值数据分布的精确表示。它是连续变量的概率分布的估计,它是一种条形图。要构建直方图,请按照以下步骤操作 -
Bin值范围。将整个值范围划分为一系列间隔。计算每个间隔中有多少值。
直方图的参数:
x - 数组或数组序列。
bins - 整数或序列或auto,可选项。
range - bins的下部和上部范围。
density - 如果为True,则返回元组的第一个元素将是规范化以形成概率密度的计数。
cumulative - 如果为True,则计算直方图,其中每个bin给出该bin中的计数加上较小值的所有bin。
histtype - 要绘制的直方图的类型,默认为bar。
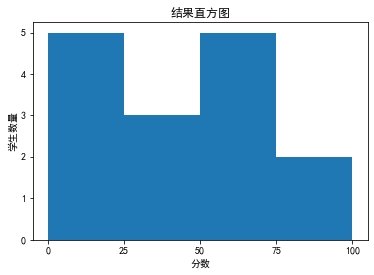
plt.rcParams['font.sans-serif'] = ['SimHei']
plt.rcParams['axes.unicode_minus'] = False
fig,ax = plt.subplots(1,1)
a = np.array([22,87,5,43,56,73,55,54,11,20,51,5,79,31,27])
ax.hist(a, bins = [0,25,50,75,100])
ax.set_title("结果直方图")
ax.set_xticks([0,25,50,75,100])
ax.set_xlabel('分数')
ax.set_ylabel('学生数量')
plt.show()

饼图
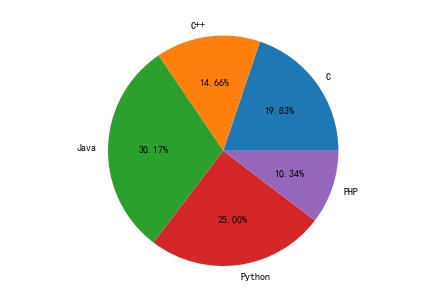
饼图只能显示一系列数据。饼图在一个数据系列中显示项目的大小(称为楔形),与项目的总和成比例。饼图中的数据点显示为整个饼图的百分比。
Matplotlib API有一个pie()
函数,它生成一个表示数组中数据的饼图。每个楔形的分数面积由x/sum(x)
给出。如果sum(x<1
,那么x
的值直接给出小数区域,并且数组将不被标准化。结果饼图将有一个大小为1
的空楔 - sum(x)。
如果图形和轴是方形,或者轴方向相等,则饼图看起来最佳。
下表列出了饼图的参数 -
x
- 数组式,楔形大小。labels
- 列表。一系列字符串,为每个楔形提供标签。colors
- 一系列matplotlib颜色参数,饼图将通过它循环。如果为None
,将使用当前活动周期中的颜色。Autopct
-string
用于用数值标记楔形。标签将放在楔子内。格式字符串将为fmt%pct
。
plt.rcParams['font.sans-serif'] = ['SimHei']
plt.rcParams['axes.unicode_minus'] = False
fig = plt.figure()
ax = fig.add_axes([0,0,1,1])
ax.axis('equal')
langs = ['C', 'C++', 'Java', 'Python', 'PHP']
students = [23,17,35,29,12]
ax.pie(students, labels = langs,autopct='%1.2f%%')
plt.show()

散点图
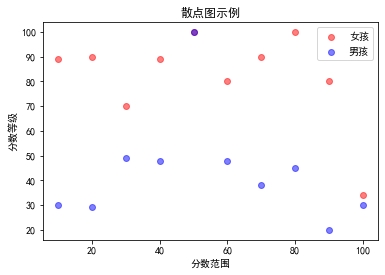
散点图用于绘制水平轴和垂直轴上的数据点,以试图显示一个变量受另一个变量影响的程度。数据表中的每一行都由一个标记表示,该位置取决于其在X和Y轴上设置的列中的值。可以将第三个变量设置为对应于标记的颜色或大小,从而为该图添加另一个维度。
pip install seaborn -i https://mirrors.aliyun.com/pypi/simple
import seaborn as sns
plt.rcParams['font.sans-serif'] = ['SimHei']
plt.rcParams['axes.unicode_minus'] = False
girls_grades = [89, 90, 70, 89, 100, 80, 90, 100, 80, 34]
boys_grades = [30, 29, 49, 48, 100, 48, 38, 45, 20, 30]
grades_range = [10, 20, 30, 40, 50, 60, 70, 80, 90, 100]
#plt.legend(labels = ('男孩','女孩'),loc='upper left')
plt.scatter(grades_range, girls_grades, color='r', alpha=0.5)
plt.scatter(grades_range, boys_grades, color='b', alpha=0.5)
plt.title('散点图示例')#显示图表标题
plt.xlabel('分数范围')#x轴名称
plt.ylabel('分数等级')#y轴名称
plt.grid(False)#显示网格线
plt.legend(labels = ('女孩','男孩'),loc='upper right')
plt.show()

轮廓图
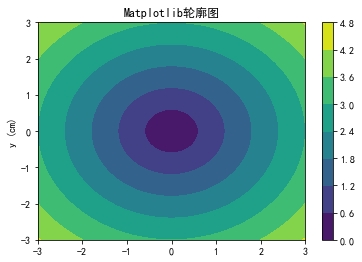
轮廓图(有时称为“水平图”)是一种在二维平面上显示三维表面的方法。 它绘制了y
轴上的两个预测变量X Y和轮廓的响应变量Z
。 这些轮廓有时称为z
切片或等响应值。
如果要查看Z
如何随两个输入X
和Y
的变化而变化,则轮廓图是非常适用的,例如Z = f(X,Y)
。 两个变量函数的等值线或等值线是函数具有常数值的曲线。
自变量x
和y
通常限于称为meshgrid
的规则网格。 numpy.meshgrid
使用x
值数组和y值数组创建一个矩形网格。
Matplotlib API包含分别绘制轮廓线和填充轮廓的contour()
和contourf()
函数。 两个函数都需要三个参数x
,y
和z
。
xlist = np.linspace(-3.0, 3.0, 100)
print(xlist)
ylist = np.linspace(-3.0, 3.0, 100)
X, Y = np.meshgrid(xlist, ylist)
print(X)
Z = np.sqrt(X**2 + Y**2)
print(Z)
fig,ax=plt.subplots(1,1)
cp = ax.contourf(X, Y, Z)
fig.colorbar(cp) # Add a colorbar to a plot
ax.set_title('Matplotlib轮廓图')
#ax.set_xlabel('x (cm)')
ax.set_ylabel('y (cm)')
plt.show()
[-3. -2.93939394 -2.87878788 -2.81818182 -2.75757576 -2.6969697
-2.63636364 -2.57575758 -2.51515152 -2.45454545 -2.39393939 -2.33333333
-2.27272727 -2.21212121 -2.15151515 -2.09090909 -2.03030303 -1.96969697
-1.90909091 -1.84848485 -1.78787879 -1.72727273 -1.66666667 -1.60606061
-1.54545455 -1.48484848 -1.42424242 -1.36363636 -1.3030303 -1.24242424
-1.18181818 -1.12121212 -1.06060606 -1. -0.93939394 -0.87878788
-0.81818182 -0.75757576 -0.6969697 -0.63636364 -0.57575758 -0.51515152
-0.45454545 -0.39393939 -0.33333333 -0.27272727 -0.21212121 -0.15151515
-0.09090909 -0.03030303 0.03030303 0.09090909 0.15151515 0.21212121
0.27272727 0.33333333 0.39393939 0.45454545 0.51515152 0.57575758
0.63636364 0.6969697 0.75757576 0.81818182 0.87878788 0.93939394
1. 1.06060606 1.12121212 1.18181818 1.24242424 1.3030303
1.36363636 1.42424242 1.48484848 1.54545455 1.60606061 1.66666667
1.72727273 1.78787879 1.84848485 1.90909091 1.96969697 2.03030303
2.09090909 2.15151515 2.21212121 2.27272727 2.33333333 2.39393939
2.45454545 2.51515152 2.57575758 2.63636364 2.6969697 2.75757576
2.81818182 2.87878788 2.93939394 3. ]
[[-3. -2.93939394 -2.87878788 ... 2.87878788 2.93939394
3. ]
[-3. -2.93939394 -2.87878788 ... 2.87878788 2.93939394
3. ]
[-3. -2.93939394 -2.87878788 ... 2.87878788 2.93939394
3. ]
...
[-3. -2.93939394 -2.87878788 ... 2.87878788 2.93939394
3. ]
[-3. -2.93939394 -2.87878788 ... 2.87878788 2.93939394
3. ]
[-3. -2.93939394 -2.87878788 ... 2.87878788 2.93939394
3. ]]
[[4.24264069 4.20000437 4.15781429 ... 4.15781429 4.20000437 4.24264069]
[4.20000437 4.15693077 4.11429901 ... 4.11429901 4.15693077 4.20000437]
[4.15781429 4.11429901 4.07122086 ... 4.07122086 4.11429901 4.15781429]
...
[4.15781429 4.11429901 4.07122086 ... 4.07122086 4.11429901 4.15781429]
[4.20000437 4.15693077 4.11429901 ... 4.11429901 4.15693077 4.20000437]
[4.24264069 4.20000437 4.15781429 ... 4.15781429 4.20000437 4.24264069]]

3D图
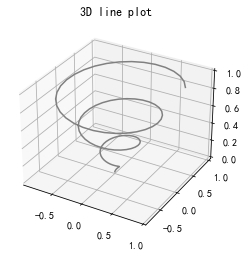
尽管Matplotlib最初设计时只考虑了二维绘图,但是在后来的版本中,Matplotlib的二维显示器上构建了一些三维绘图实用程序,以提供一组三维数据可视化工具。通过导入Matplotlib包中包含的mplot3d
工具包,可以启用三维图。
可以通过将关键字projection ='3d'
传递给任何法线轴创建例程来创建三维轴。
import seaborn as sns
plt.rcParams['font.sans-serif'] = ['SimHei'] # 步骤一(替换sans-serif字体)
plt.rcParams['axes.unicode_minus'] = False # 原文出自【易百教程】,商业转载请联系作者获得授权,非商业请保留原文链接:
from mpl_toolkits import mplot3d
fig = plt.figure()
ax = plt.axes(projection='3d')
z = np.linspace(0, 1, 100)
x = z * np.sin(20 * z)
y = z * np.cos(20 * z)
ax.plot3D(x, y, z, 'gray')
ax.set_title('3D line plot')
plt.show()

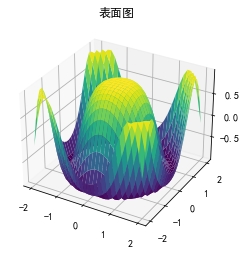
3D曲面图
曲面图显示指定的因变量(Y
)和两个独立变量(X
和Z
)之间的函数关系。该图是等高线图的伴随图。曲面图类似于线框图,但线框的每个面都是填充多边形。这可以帮助感知可视化曲面拓扑。plot_surface()
函数x
,y
和z
作为参数。
import seaborn as sns
plt.rcParams['font.sans-serif'] = ['SimHei'] # 步骤一(替换sans-serif字体)
plt.rcParams['axes.unicode_minus'] = False # 原文出自【易百教程】,商业转载请联系作者获得授权,非商业请保留原文链接:
from mpl_toolkits import mplot3d
x = np.outer(np.linspace(-2, 2, 30), np.ones(30))
y = x.copy().T # transpose
z = np.cos(x ** 2 + y ** 2)
fig = plt.figure()
ax = plt.axes(projection='3d')
ax.plot_surface(x, y, z,cmap='viridis', edgecolor='none')
ax.set_title('表面图')
plt.show()

格式化轴
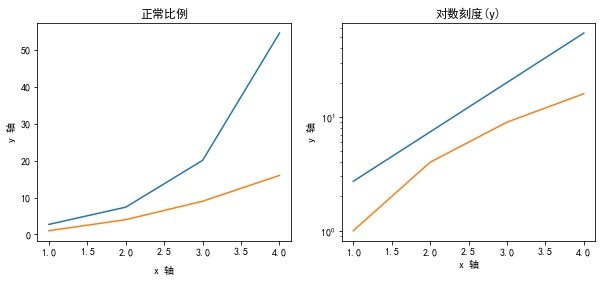
有时候一个或几个点比大量数据大得多。在这种情况下,轴的比例需要设置为对数(log
)而不是正常比例。这是对数标度。在Matplotlib中,可以通过将axes
对象的xscale
或vscale
属性设置为log
。
有时还需要在轴编号和轴标签之间显示一些额外的距离。任一轴(x
或y
或两者)的labelpad
属性都可以设置为所需的值。
在以下示例的帮助下演示了上述两个功能。右边的子图具有对数刻度,左边的一个子图的x
轴具有更远距离的标签。
相同的数据,在不同的刻度的情况下往往会显示出来不同的效果,这也是一种数据欺骗,有时候方便大家看,可能会对数据轴做一些手脚,起到更直观的效果。
# 显示中文设置...
plt.rcParams['font.sans-serif'] = ['SimHei']
plt.rcParams['axes.unicode_minus'] = False
fig, axes = plt.subplots(1, 2, figsize=(10,4))
x = np.arange(1,5)
axes[0].plot( x, np.exp(x))
axes[0].plot(x,x**2)
axes[0].set_title("正常比例")
axes[1].plot (x, np.exp(x))
axes[1].plot(x, x**2)
axes[1].set_yscale("log")
axes[1].set_title("对数刻度(y)")
axes[0].set_xlabel("x 轴")
axes[0].set_ylabel("y 轴")
axes[0].xaxis.labelpad = 10
axes[1].set_xlabel("x 轴")
axes[1].set_ylabel("y 轴")
plt.show()

设置刻度和刻度标签
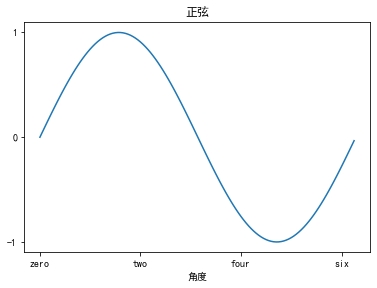
刻度是表示轴上数据点的标记。到目前为止,Matplotlib在我们之前的所有例子中都自动接管了轴上间隔点的任务。Matplotlib的默认刻度定位器和格式化器在很多常见情况下通常都足够了。可以明确提及刻度线的位置和标签以满足特定要求。
xticks()
和yticks()
函数将列表对象作为参数。列表中的元素表示将显示刻度的相应操作的位置。
ax.set_xticks([2,4,6,8,10])
Python
此方法将使用刻度标记给定位置处的数据点。类似地,对应于刻度线的标签可以分别由set_xlabels()
和set_ylabels()
函数设置。
ax.set_xlabels(['two', 'four','six', 'eight', 'ten'])
Python
它将在x
轴上的标记下方显示文本标签。以下示例演示了刻度线和标签的使用。
import math
plt.rcParams['font.sans-serif'] = ['SimHei']
plt.rcParams['axes.unicode_minus'] = False
x = np.arange(0, math.pi*2, 0.05)
fig = plt.figure()
ax = fig.add_axes([0.1, 0.1, 0.8, 0.8]) # main axes
y = np.sin(x)
ax.plot(x, y)
ax.set_xlabel('角度')
ax.set_title('正弦')
ax.set_xticks([0,2,4,6])
ax.set_xticklabels(['zero','two','four','six'])
ax.set_yticks([-1,0,1])
plt.show()

Last updated
Was this helpful?