[course]04 —— 画图 2
1. Draw a Rectangle with create_rectangle(left, top, right, bottom)
def draw(canvas, width, height):
    # The first four parameters are the upper-left (x,y)
    # and the lower-right (x,y) of the rectangle
    canvas.create_rectangle(0,0,150,150)
Result: 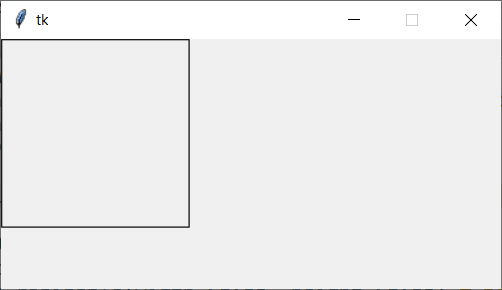
2. Graphics Parameters
def draw(canvas, width, height):
    # most graphics functions allow you to use optional parameters
    # to change the appearance of the object. These are written with the code
    # paramName=paramValue
    # after the core parameters in the code

    # fill changes the internal color of the shape
    canvas.create_rectangle(  0,   0, 150, 150, fill="yellow")
    # width changes the size of the border
    canvas.create_rectangle(100,  50, 250, 100, fill="orange", width=5)
    # outline changes the color of the border
    canvas.create_rectangle( 50, 100, 150, 200, fill="green",
                                                outline="red", width=3)
    # width=0 removes the border entirely
    canvas.create_rectangle(125,  25, 175, 190, fill="purple", width=0)
Result: 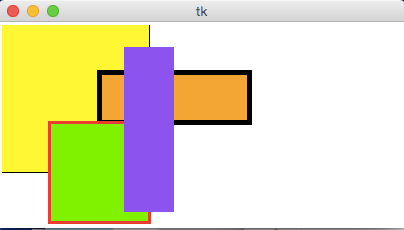
3.Draw Other Shapes and Text
Result: 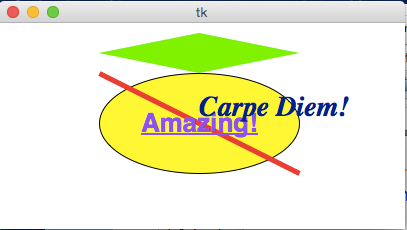 Other shapes can have optional parameters too. You don't need to know these, but they can be fun to use!
Result: 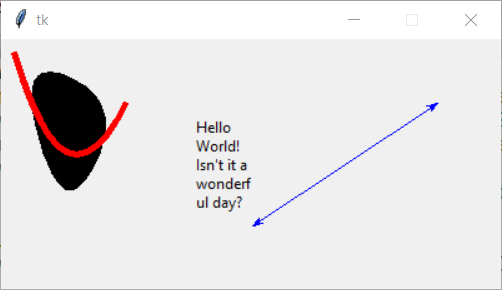
4.Draw Custom Colors
Result: 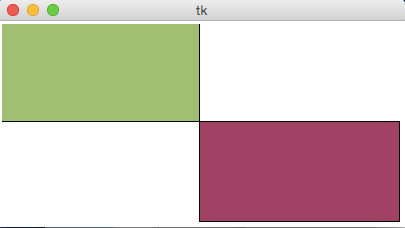
5. Draw Centered Shapes
Result: 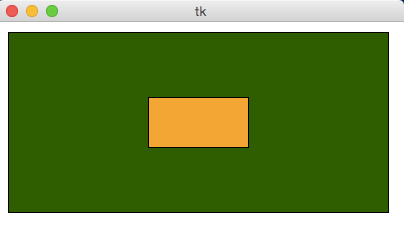
6. Graphics Helper Functions
Result: 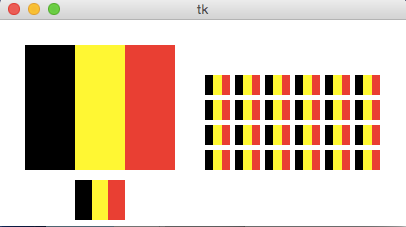
7. Dynamically sizing text
Result: 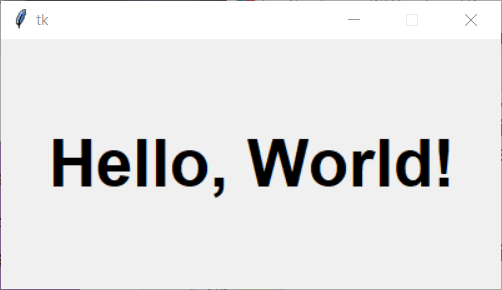
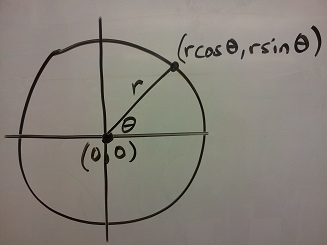
8. Drawing Circular Patterns with Trigonometry
Circle centered at origin
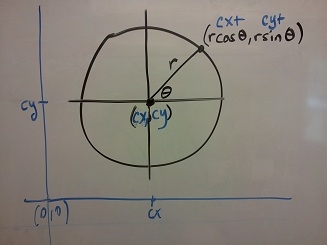
Circle centered at (cx, cy)
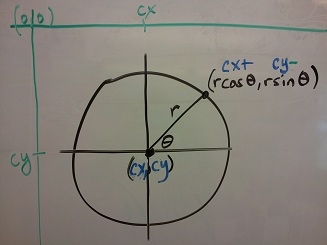
Circle centered at (cx, cy) in Python graphics ("up is down!")
 Example:
Result: 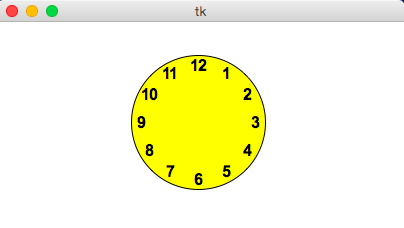
9. Example: Clocks!
Result: 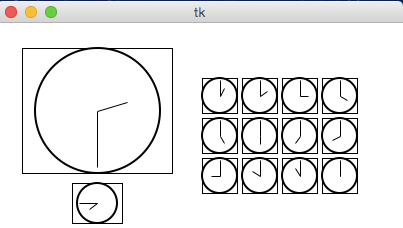
Last updated